
SmartSites is a new product created by the team at Hitachi Social Innovation. It’s purpose is to optimise off-road heavy machinery for site operators and machine owners – helping them to achieve lower costs, greater efficiencies, less downtime and more efficient production delivery.
My Role
Lead Digital Product Designer. Collaborate with the team to review work done to date and define the use-cases and USP’s for this new product. Bring user-centred thinking to the project by leading the team through various activities to scope, refine and design the final prototype.
Discover.
Review and re-frame functional spec. Plan project lifecycle.
Define.
Userflows, sketches & wireframes.
Design.
Final UI design. Interactive, high fidelity protoype.
Validate.
Review feedback from trial users to refine the product.
Discover
I encouraged the team to be more user-centric, by reframing their functional specification document into user stories. Getting into the mindset of the end user really helps to validate some of the assumptions we are making in terms of the functionality we are offering and the data we are showing. For example…
As a Rental Operator…
I want to allocate machine(s) to a customer, based on it’s suitability and specification.
I need to see where each machine is located, to plan jobs and address customer needs.
I want to view a machines predicted utilisation so I can advise customers accordingly.
I need to know when and how the customer used the machine, so I can invoice correctly.
I need a technical overview of a machine to ensure there are no defects pre-delivery.
I need to be aware of planned maintenance schedules before allocating a machine.
As a Site Manager…
I need machine utilisation data such as fuel level, idle time, operator behaviour.
I want to see any incidents or actions to be taken, as notifications and alarms.
I have to ensure engineers are available for maintenance jobs when required.
I want to see predictive data in order to prevent unexpected break downs.
I want to see how each machine is being used, to optimise the fleet and train operators.
I need to ensure cost leadership by optimising operational and capital expenses.
Discover
I encouraged the team to be more user-centric, by reframing their functional specification document into user stories. Getting into the mindset of the end user really helps to validate some of the assumptions we are making in terms of the functionality we are offering and the data we are showing. For example…
As a Rental Operator…
I want to allocate machine(s) to a customer, based on predictive data and a manual request.
I need to see where each machine is located, to plan jobs and address customer needs.
I want to view a machines predicted utilisation so I can advice customers accordingly.
I need to know when and how the customer used the machine, so I can invoice correctly.
As a Site Manager…
I need machine utilisation data such as fuel level, Idle time, operator behaviour.
I want to see any incidents or actions to be taken, highlighted as notifications and alarms.
I have to ensure engineers are available for maintenance jobs when required.
I want to see predictive data in order to prevent unexpected break downs.
Define
Userflows
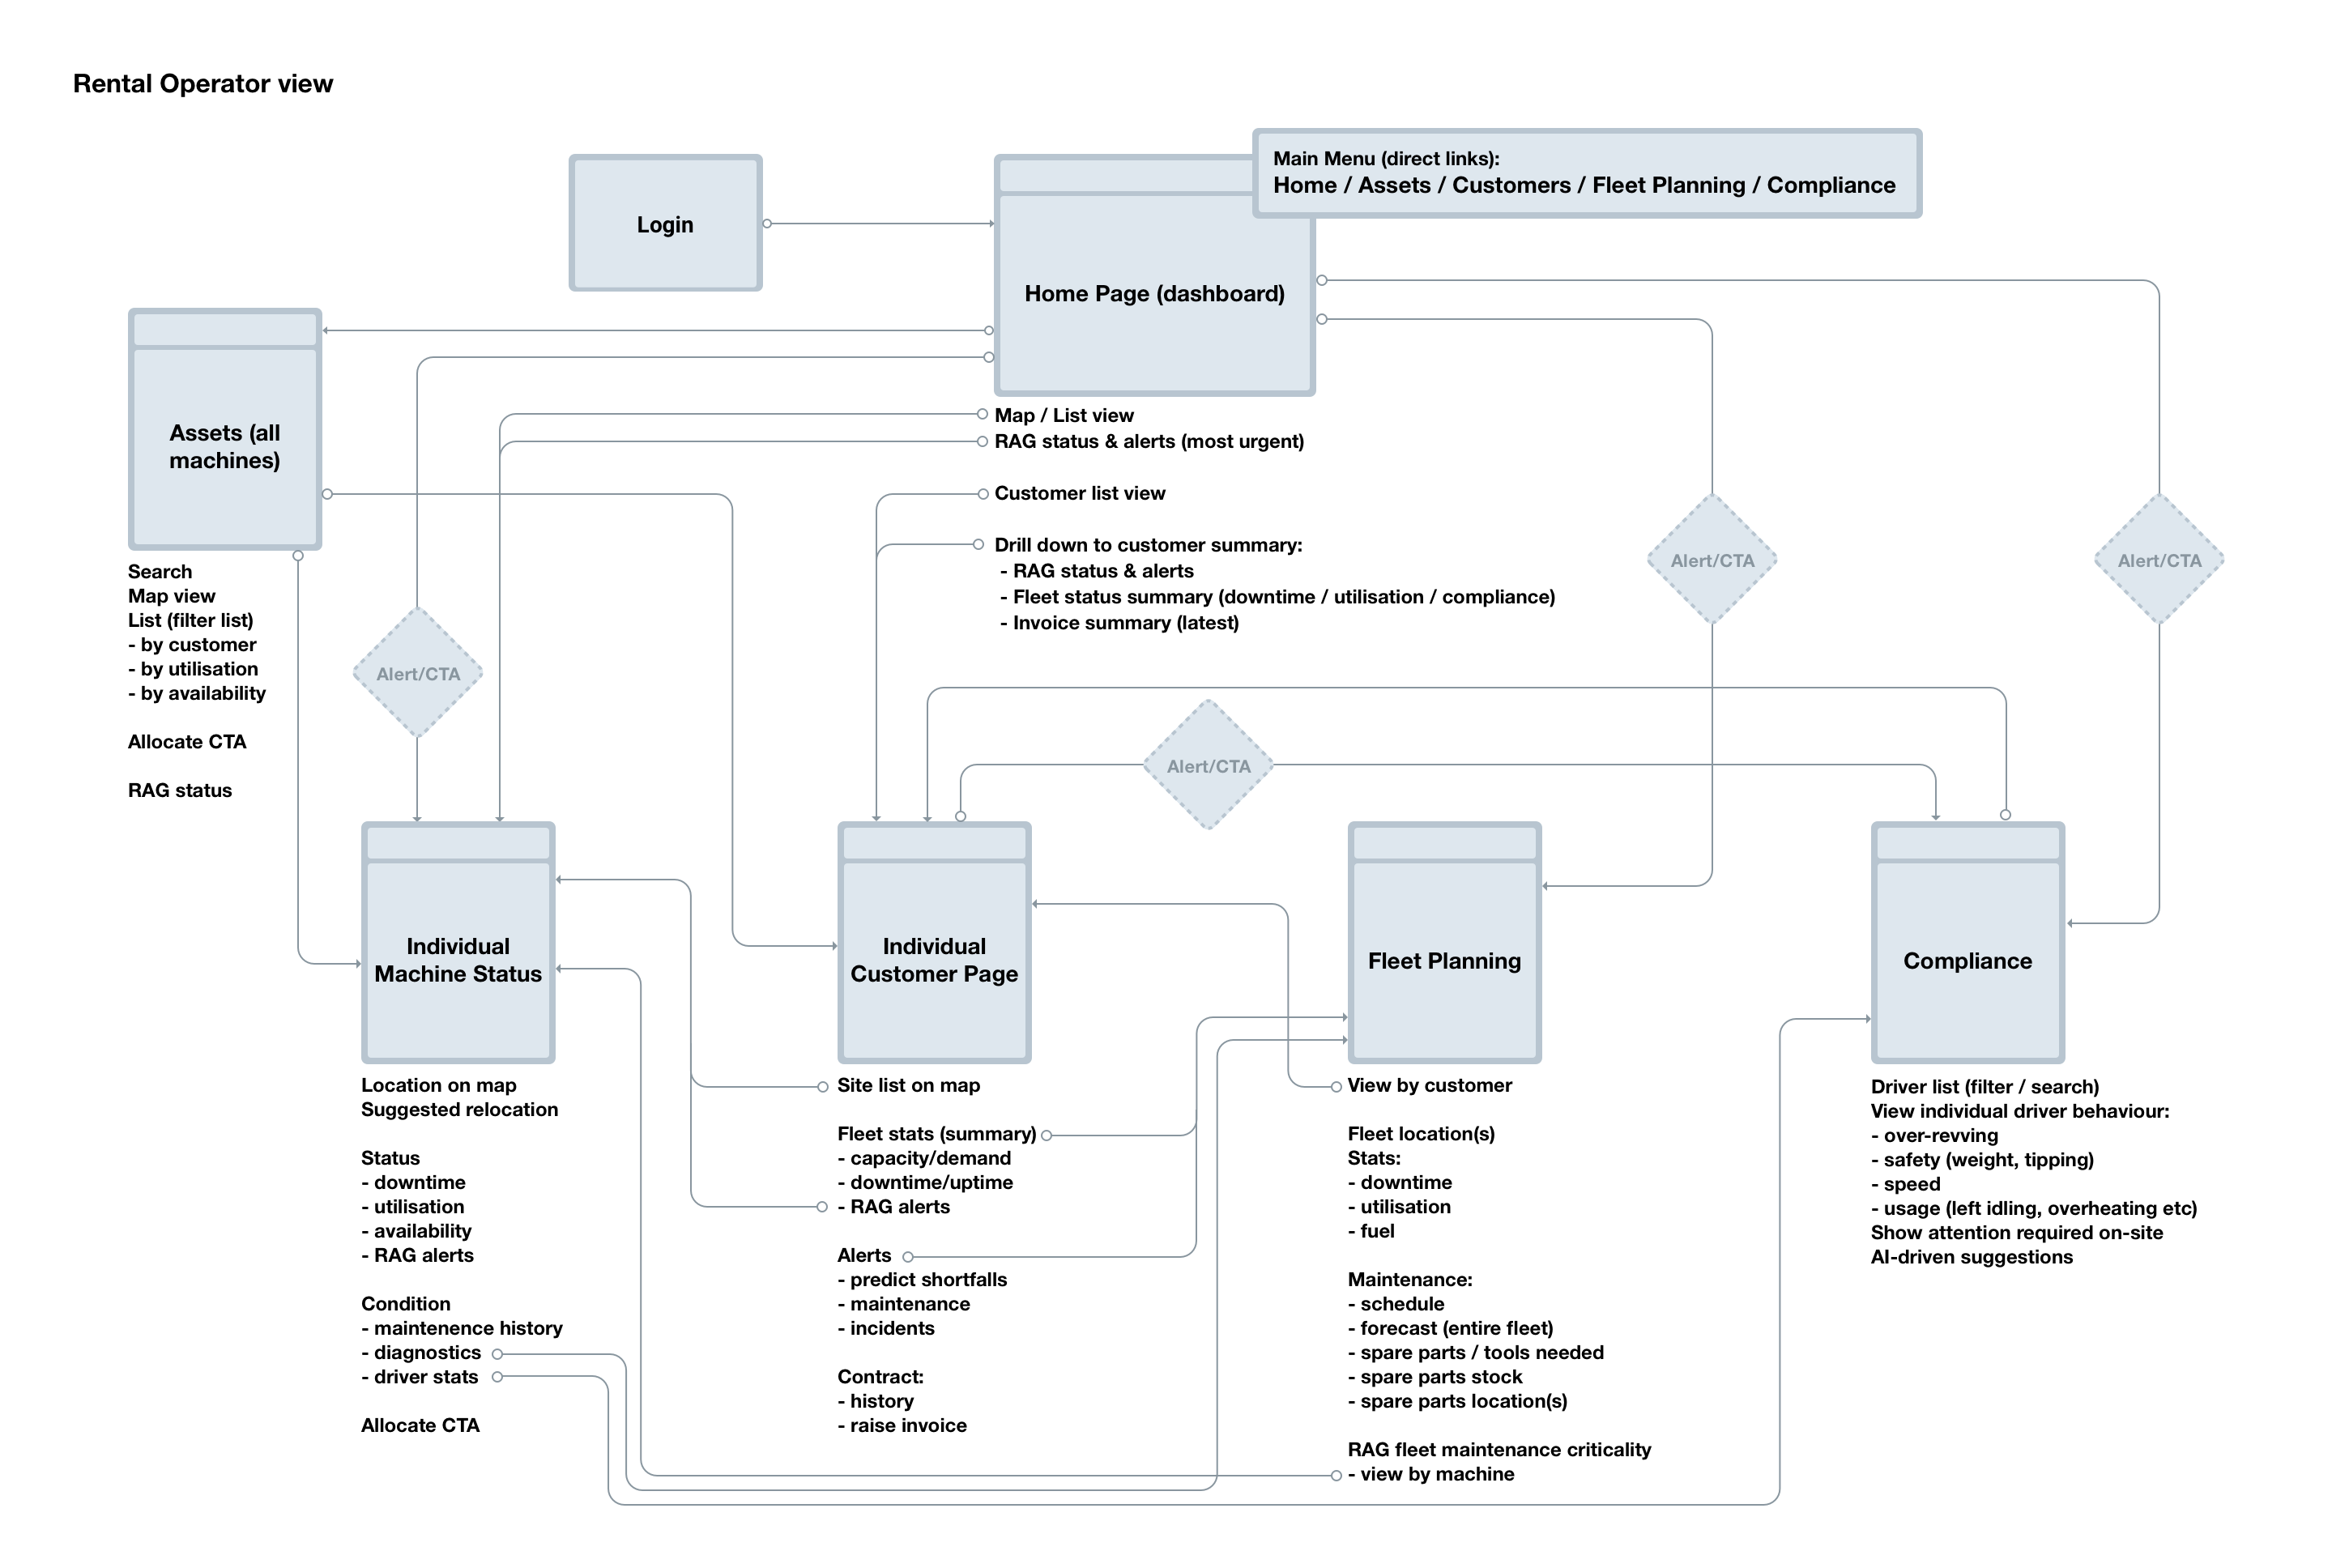
Userflows allowed us to focus on the users experience and not the design details on the screen. We were able to cross-reference the proposed flows against the requirements gathered during the ‘Discover’ phase. I opted to use a hybrid sitemap/userflow diagram because I wanted to highlight my thinking around the product architecture and show how it would aid critical user tasks.


Wireframing
The process starts with sketches. Often these are not presented to the client but they perform a vital function by allowing me to brain dump everything we’ve discussed so far. I make notes against each screen to confirm the expected functionality. Of course, things will change as we test and iterate, but everything starts with a scribble.
Interactive wireframes
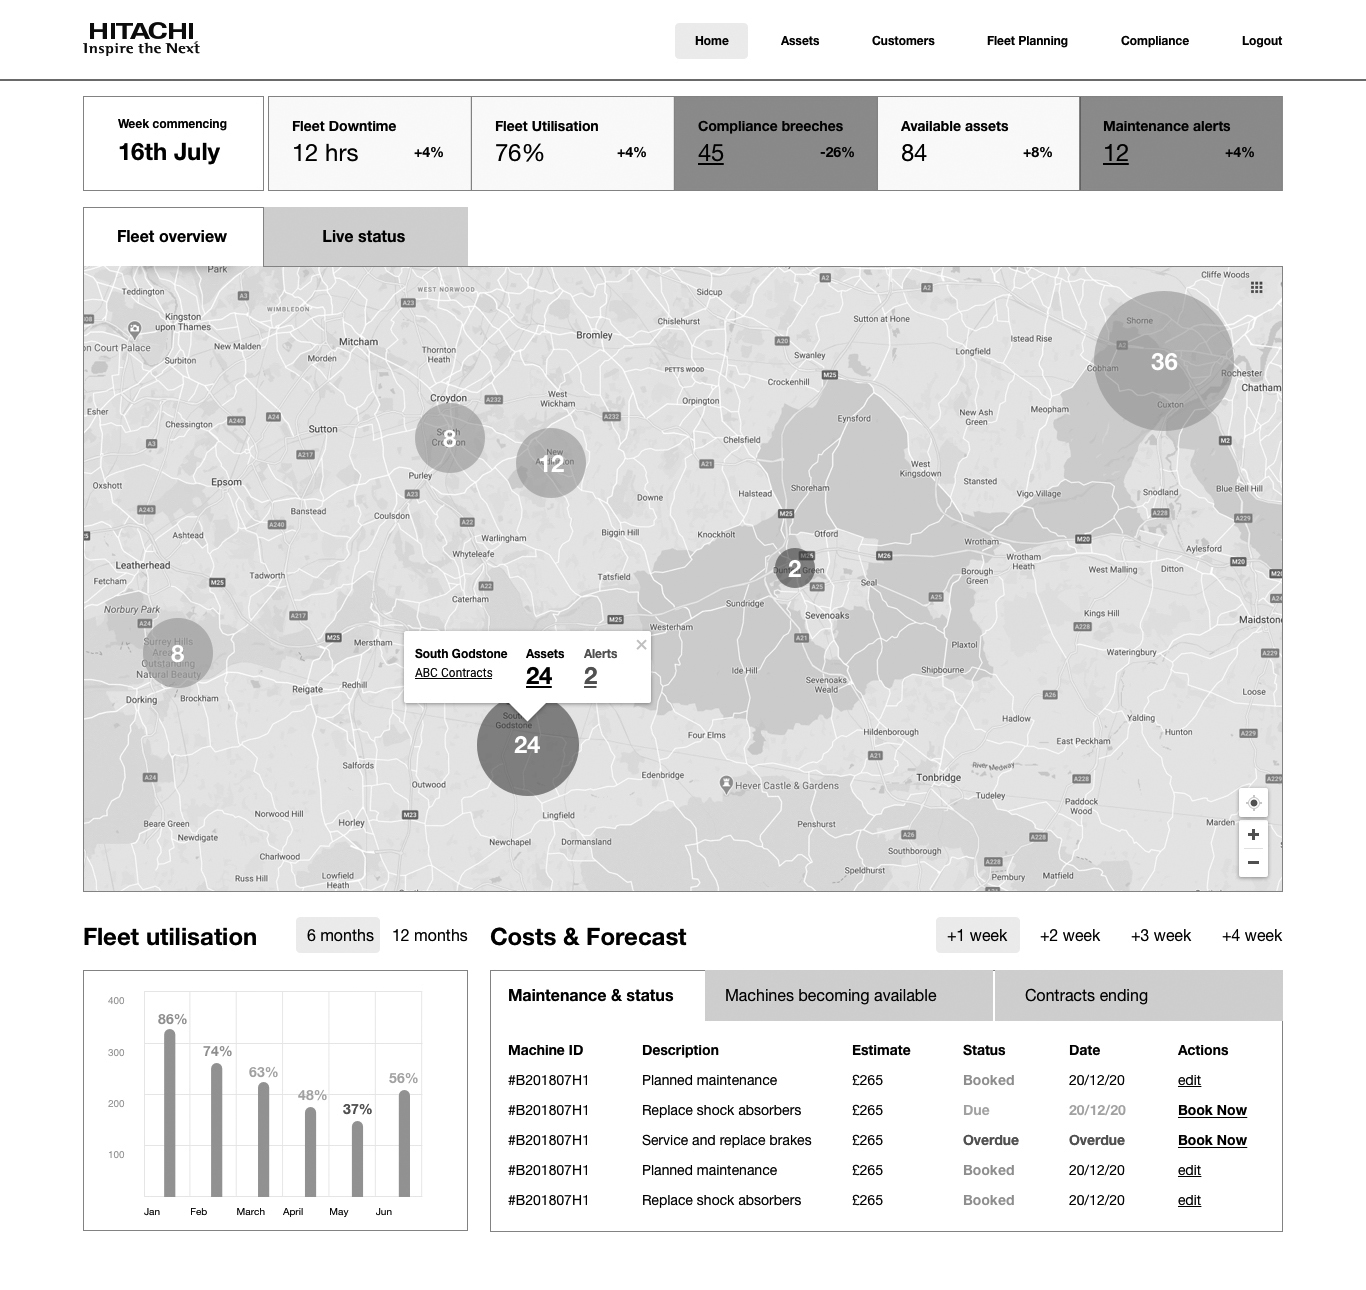
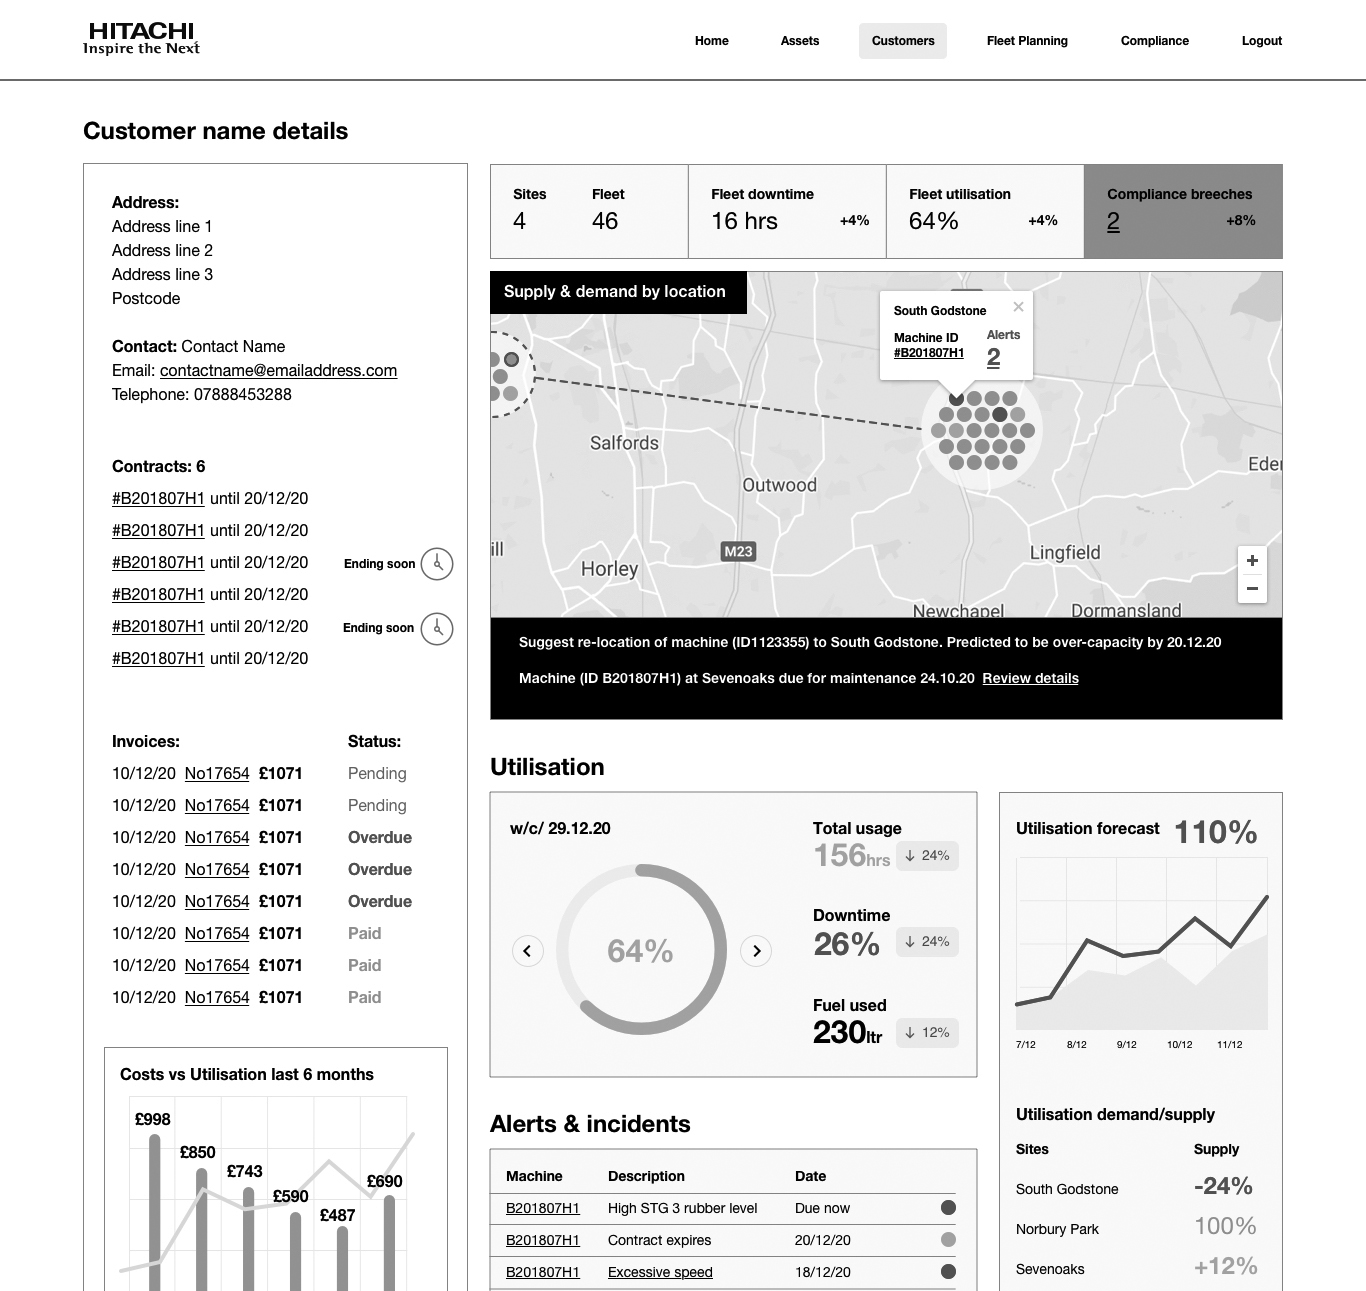
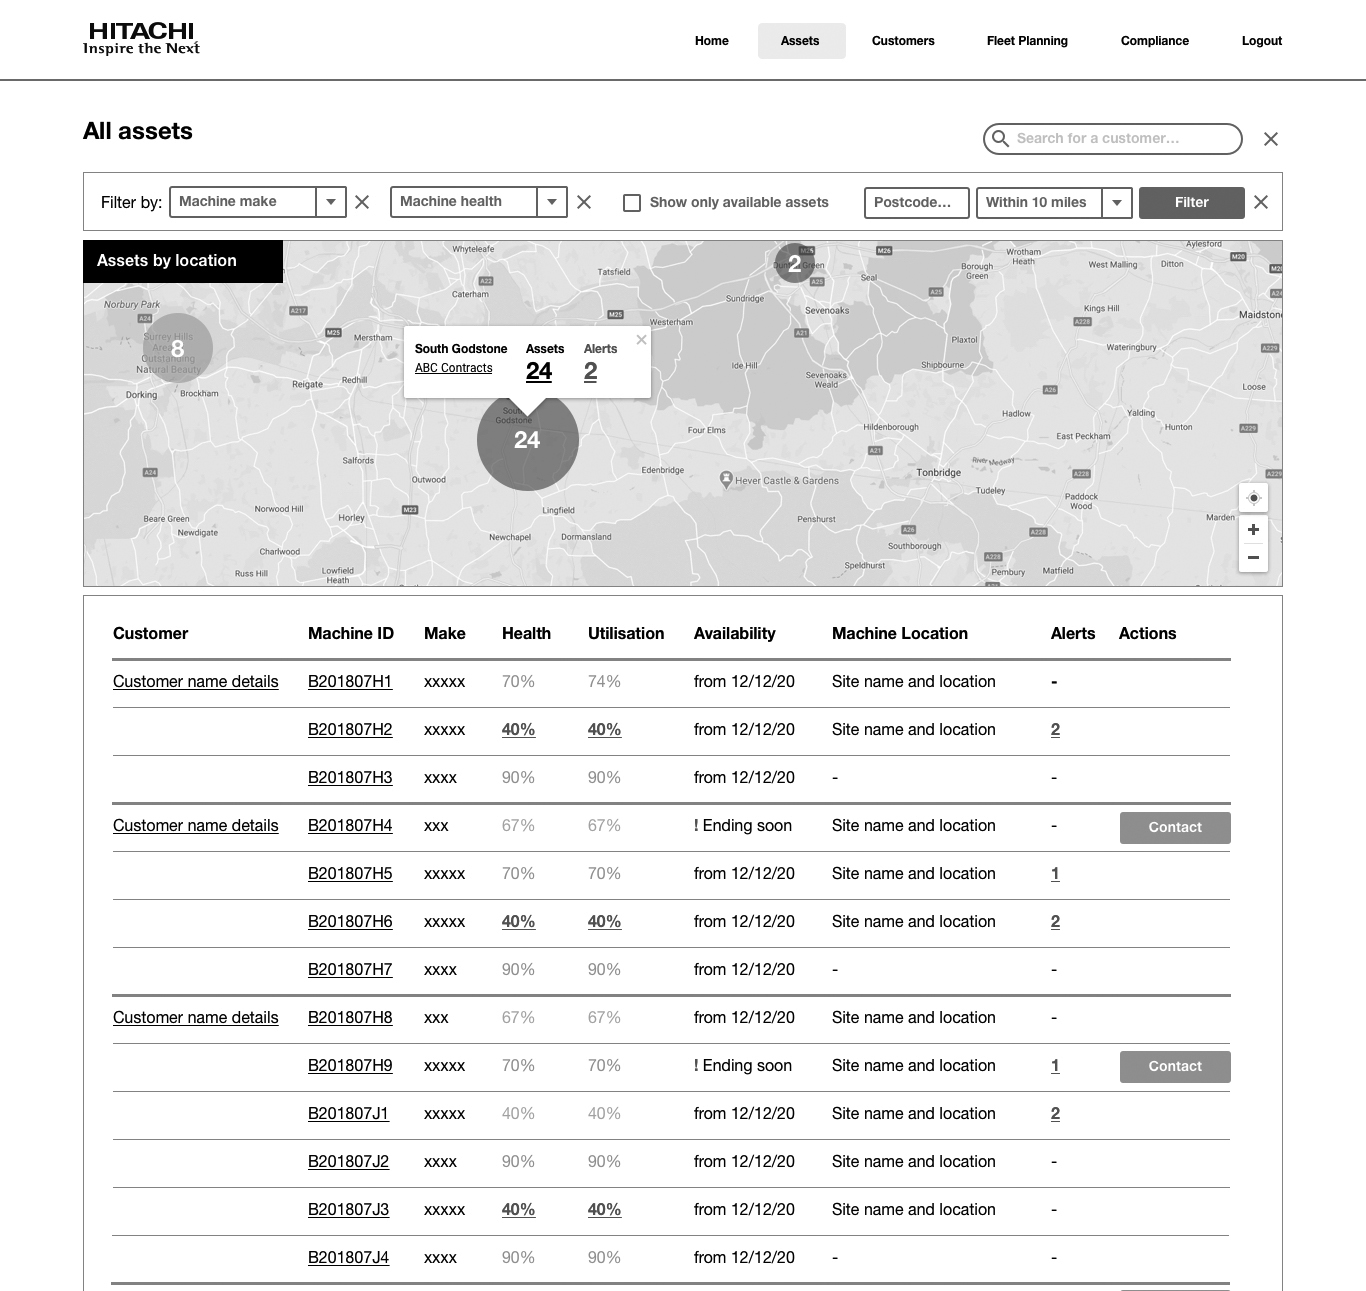
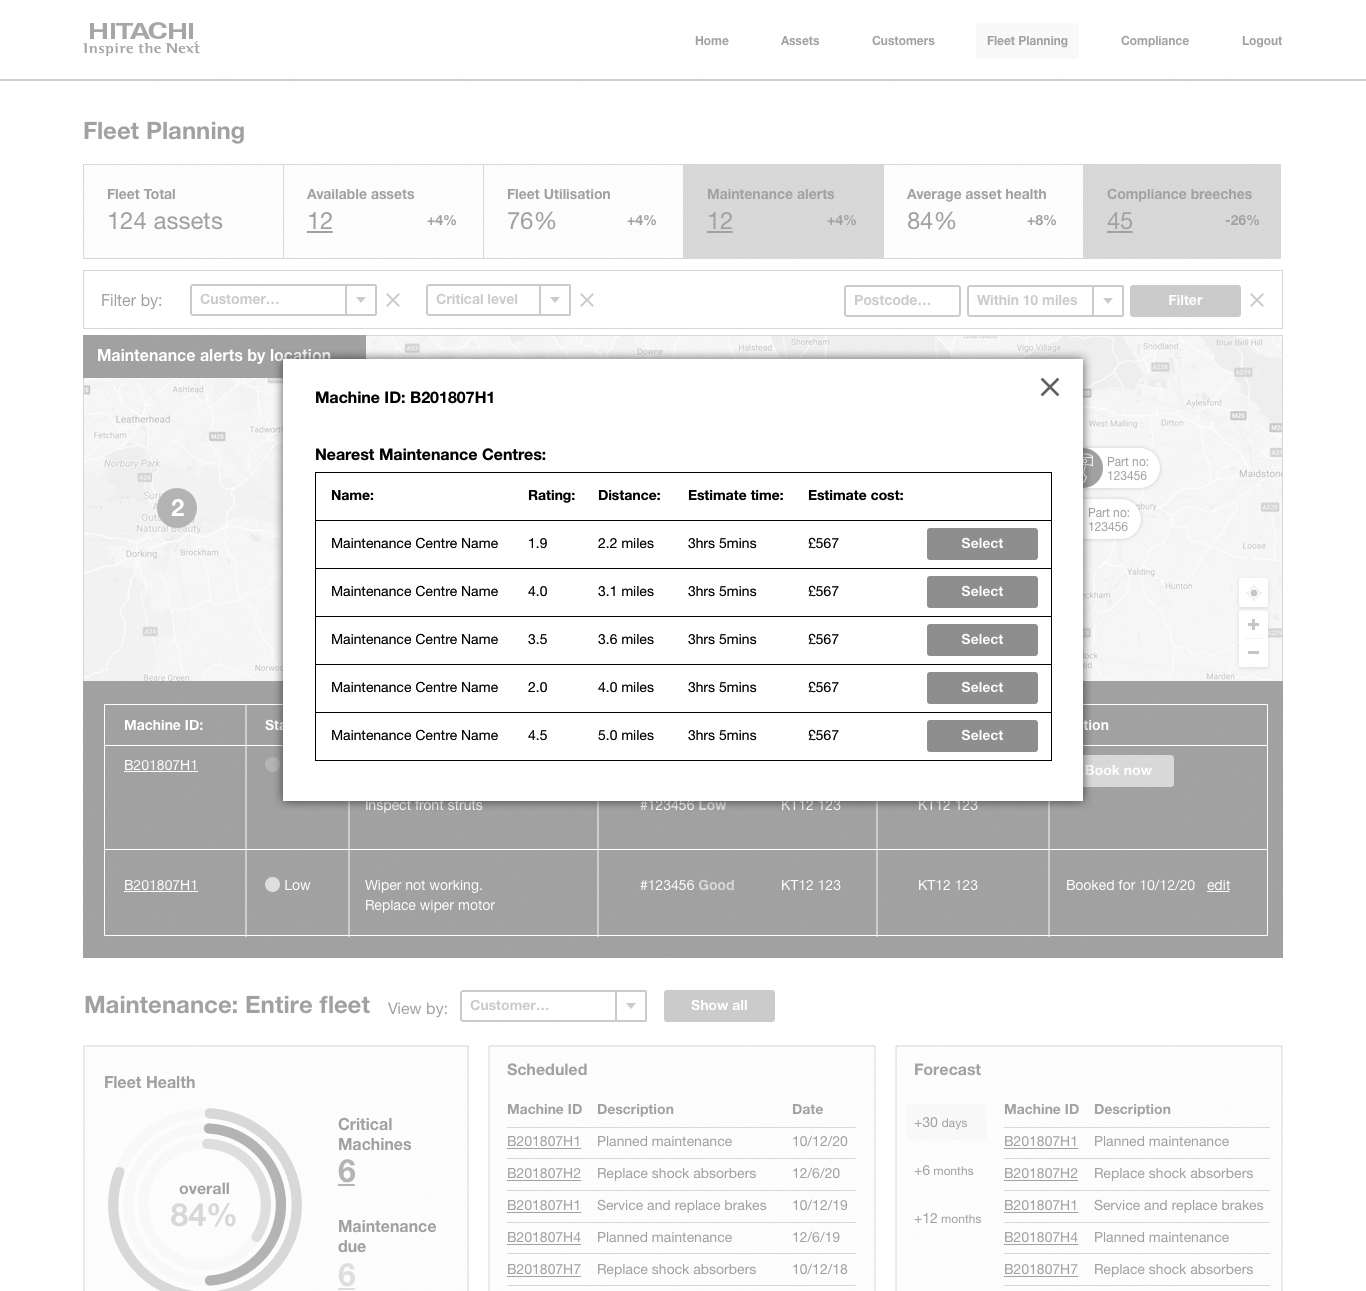
Lo-fidelity, interactive wireframes gave the team a first real taste of how the final product was going to work. This stage is purely about the functionality and the user experience, however it did give us a chance to discuss how we might tackle the design of some of the more complicated data visualisations. We were also able to user test the wireframes with stakeholders and potential users, focussing on:
Language and tone of voice
We reviewed the wording and made sure we are using consistent messaging and labeling throught the product. Thinking of the users, we wanted to avoid technical jargon and industry abbreviations.
Data visualisation
Are we showing the right data at the right time? It’s technically possible to obtain all manner of data about each machine, but is that useful? I showed the team how to reframe the data and turn it into actionable insights.
Task completion
Can the user complete the most common tasks without prompts or tuition? Is the user able to react to notifications and alarms and take action accordingly? Does the proposed product stack up against the original spec and user stories?


Design
UI Design
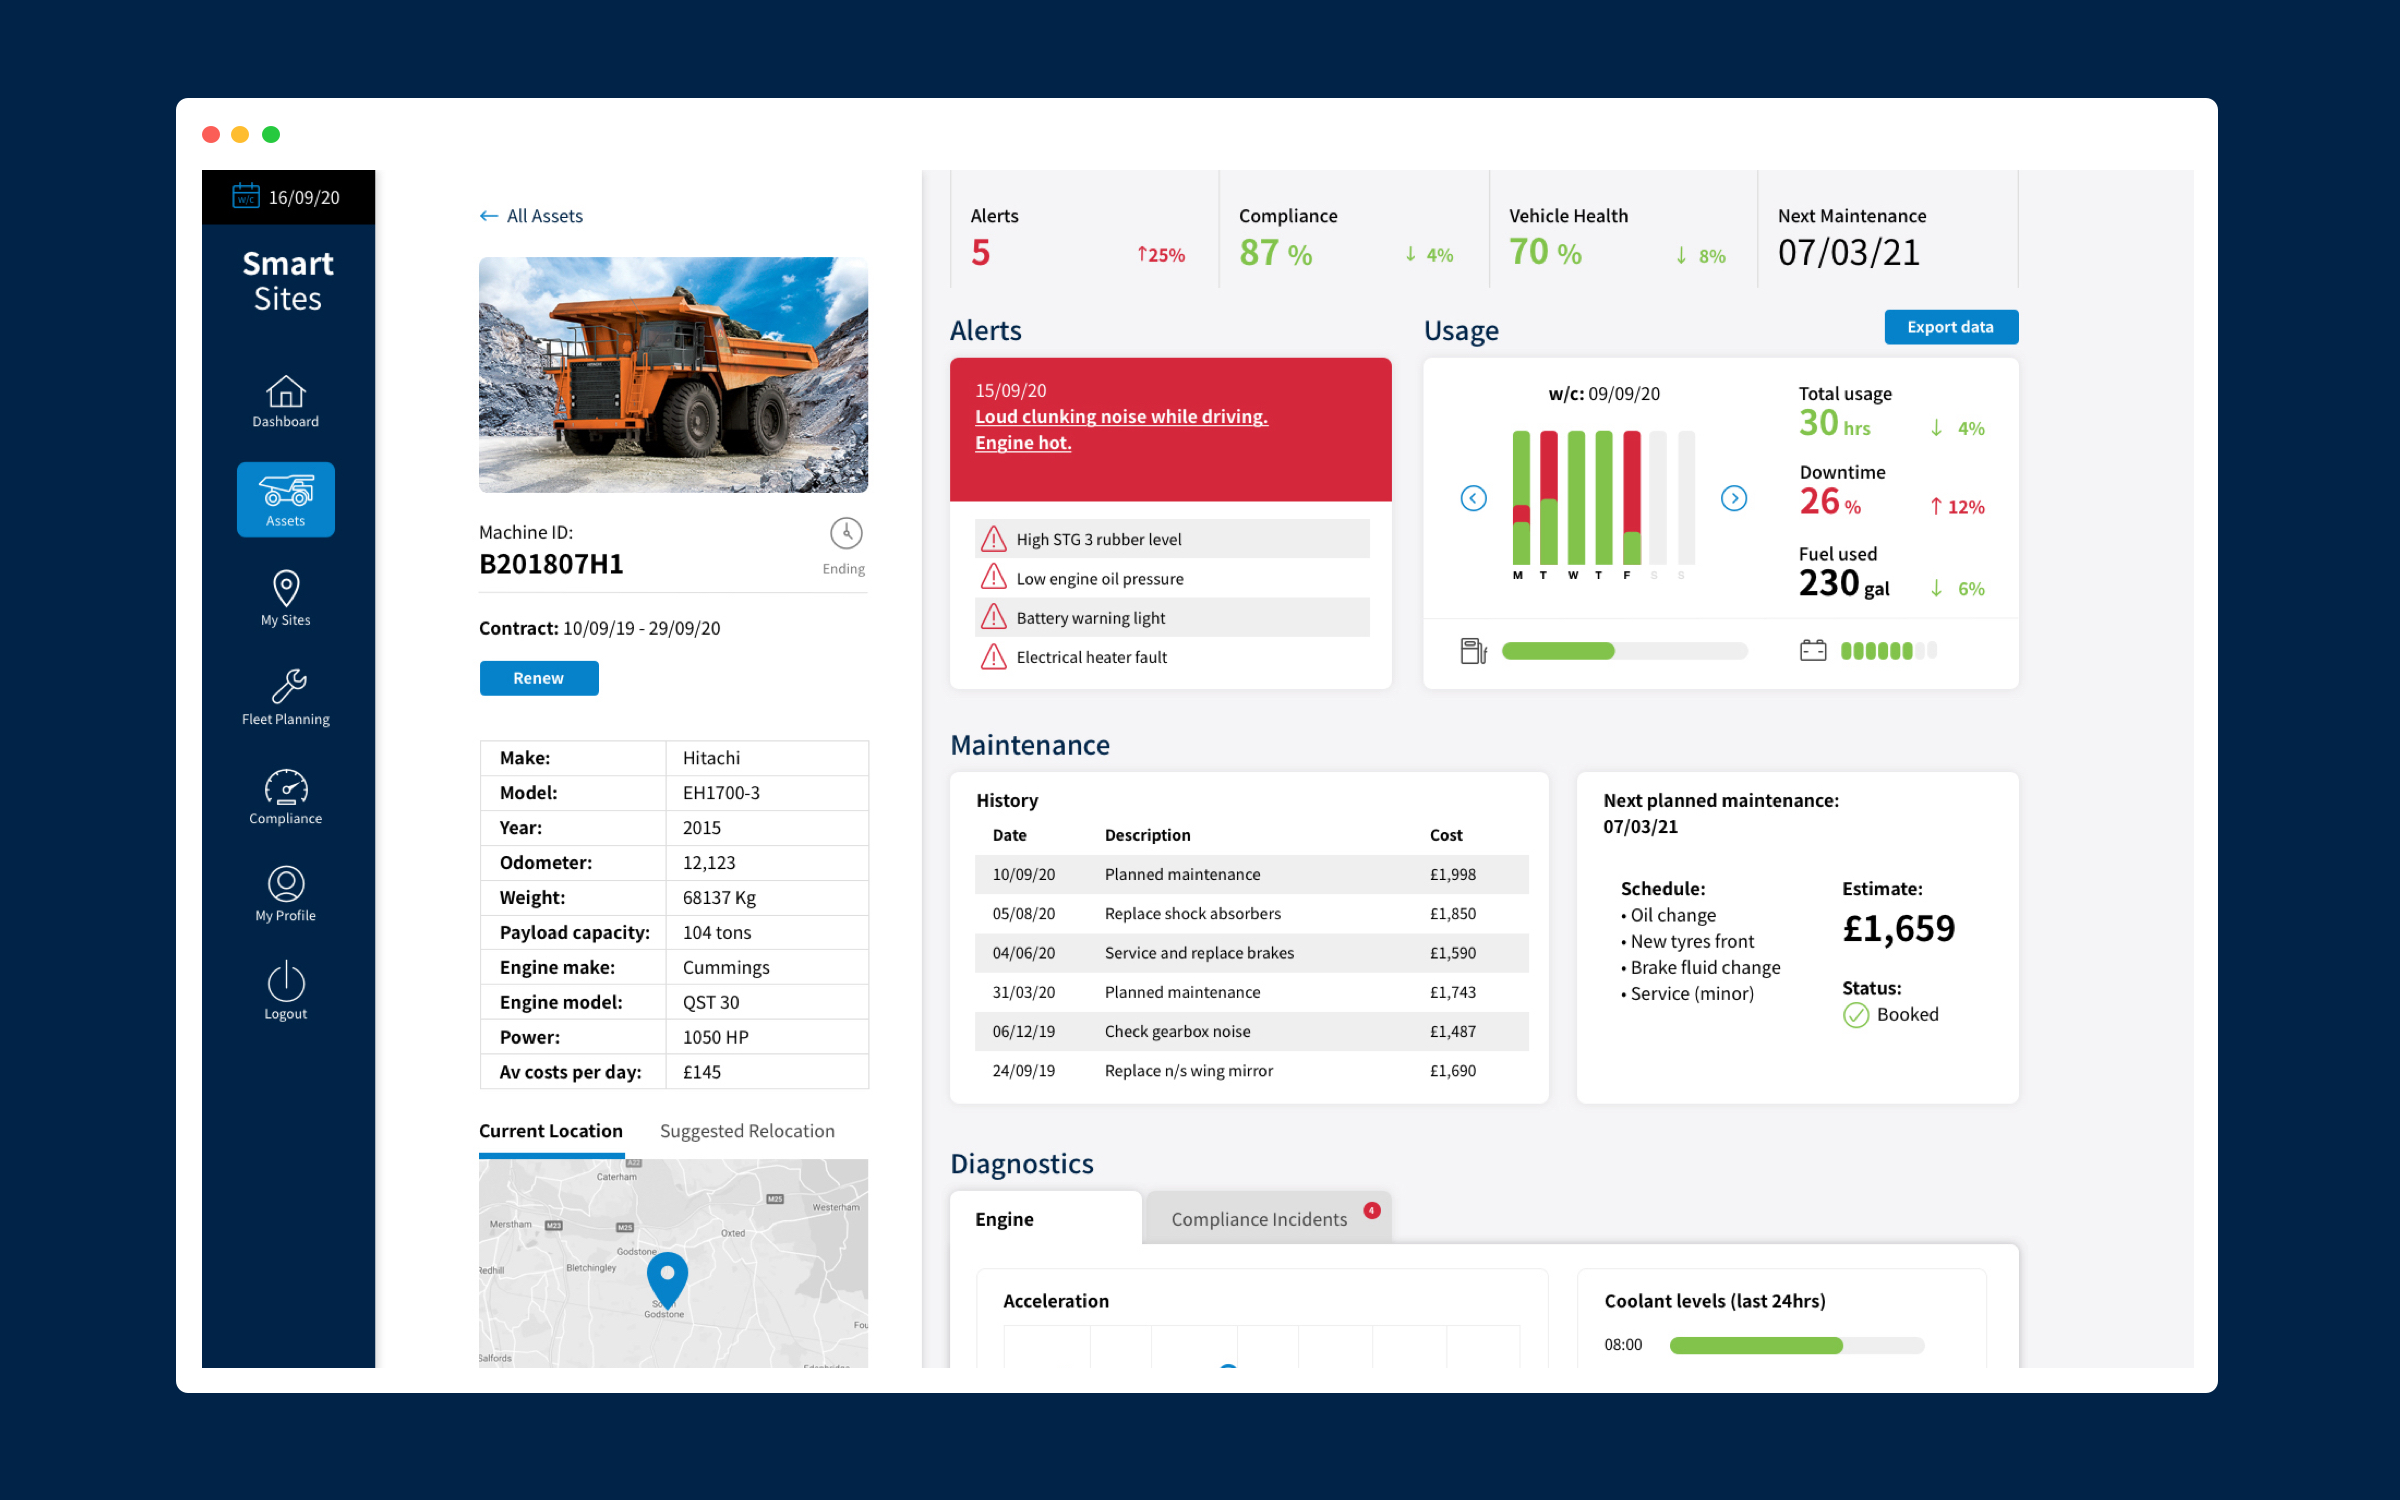
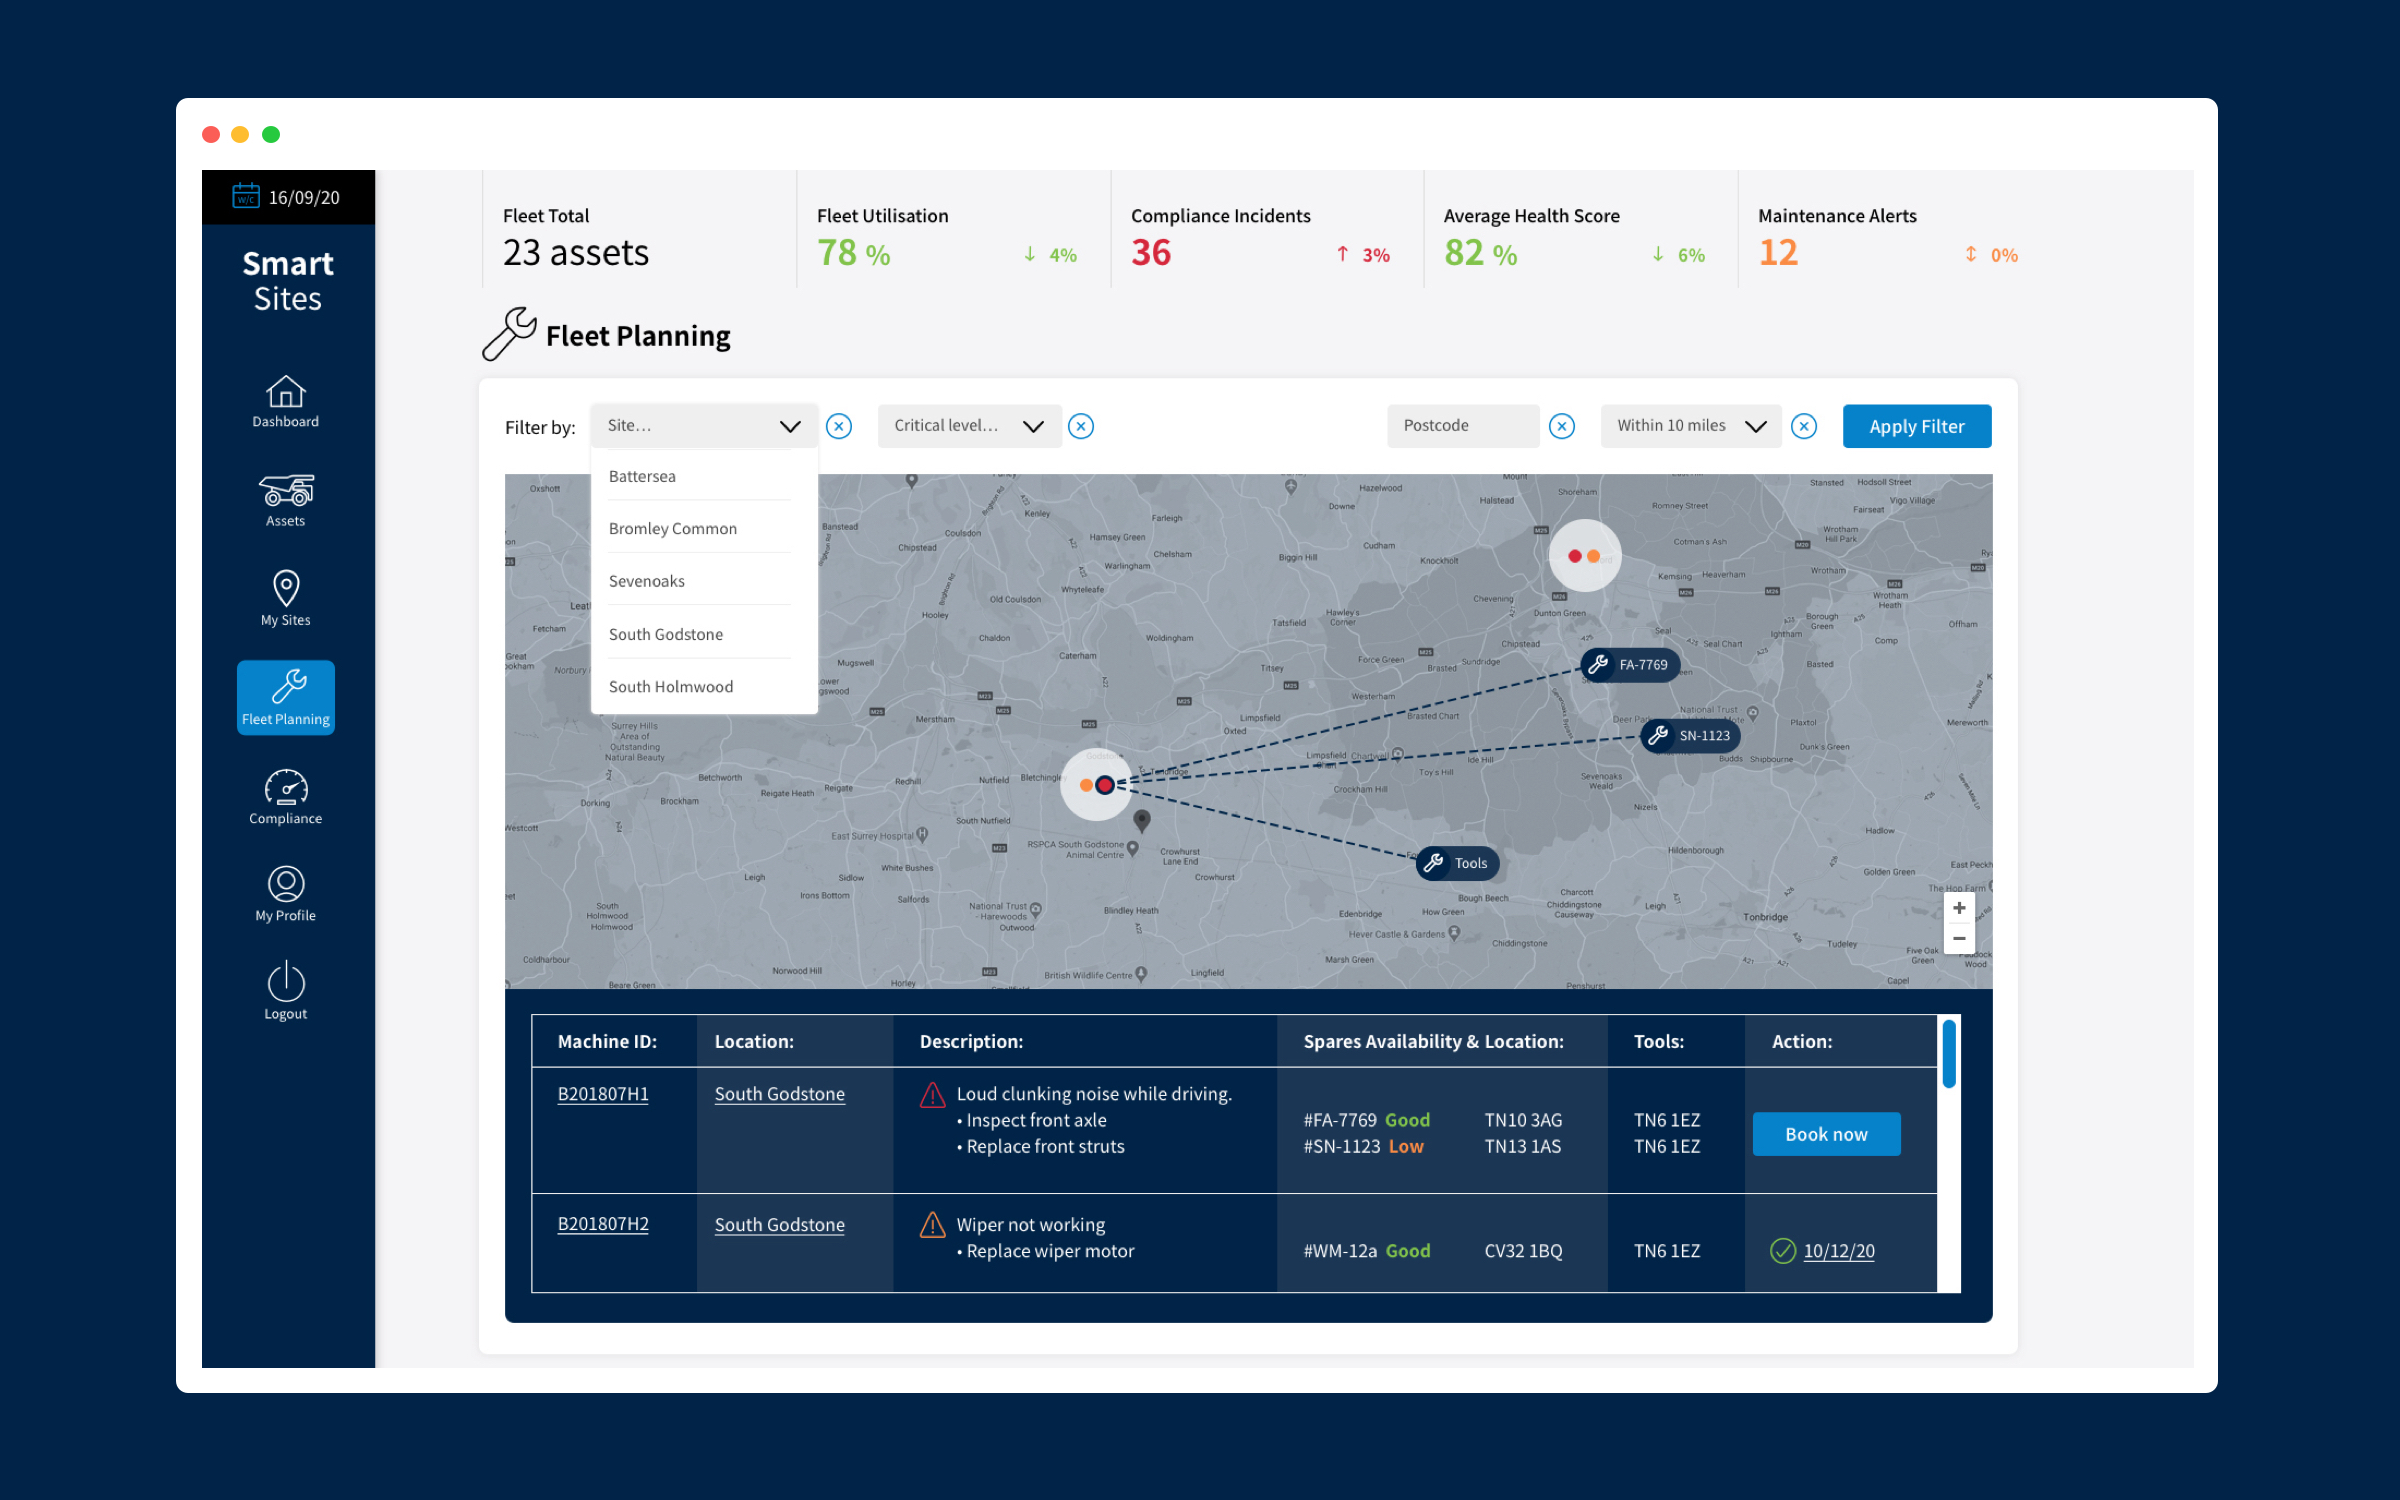
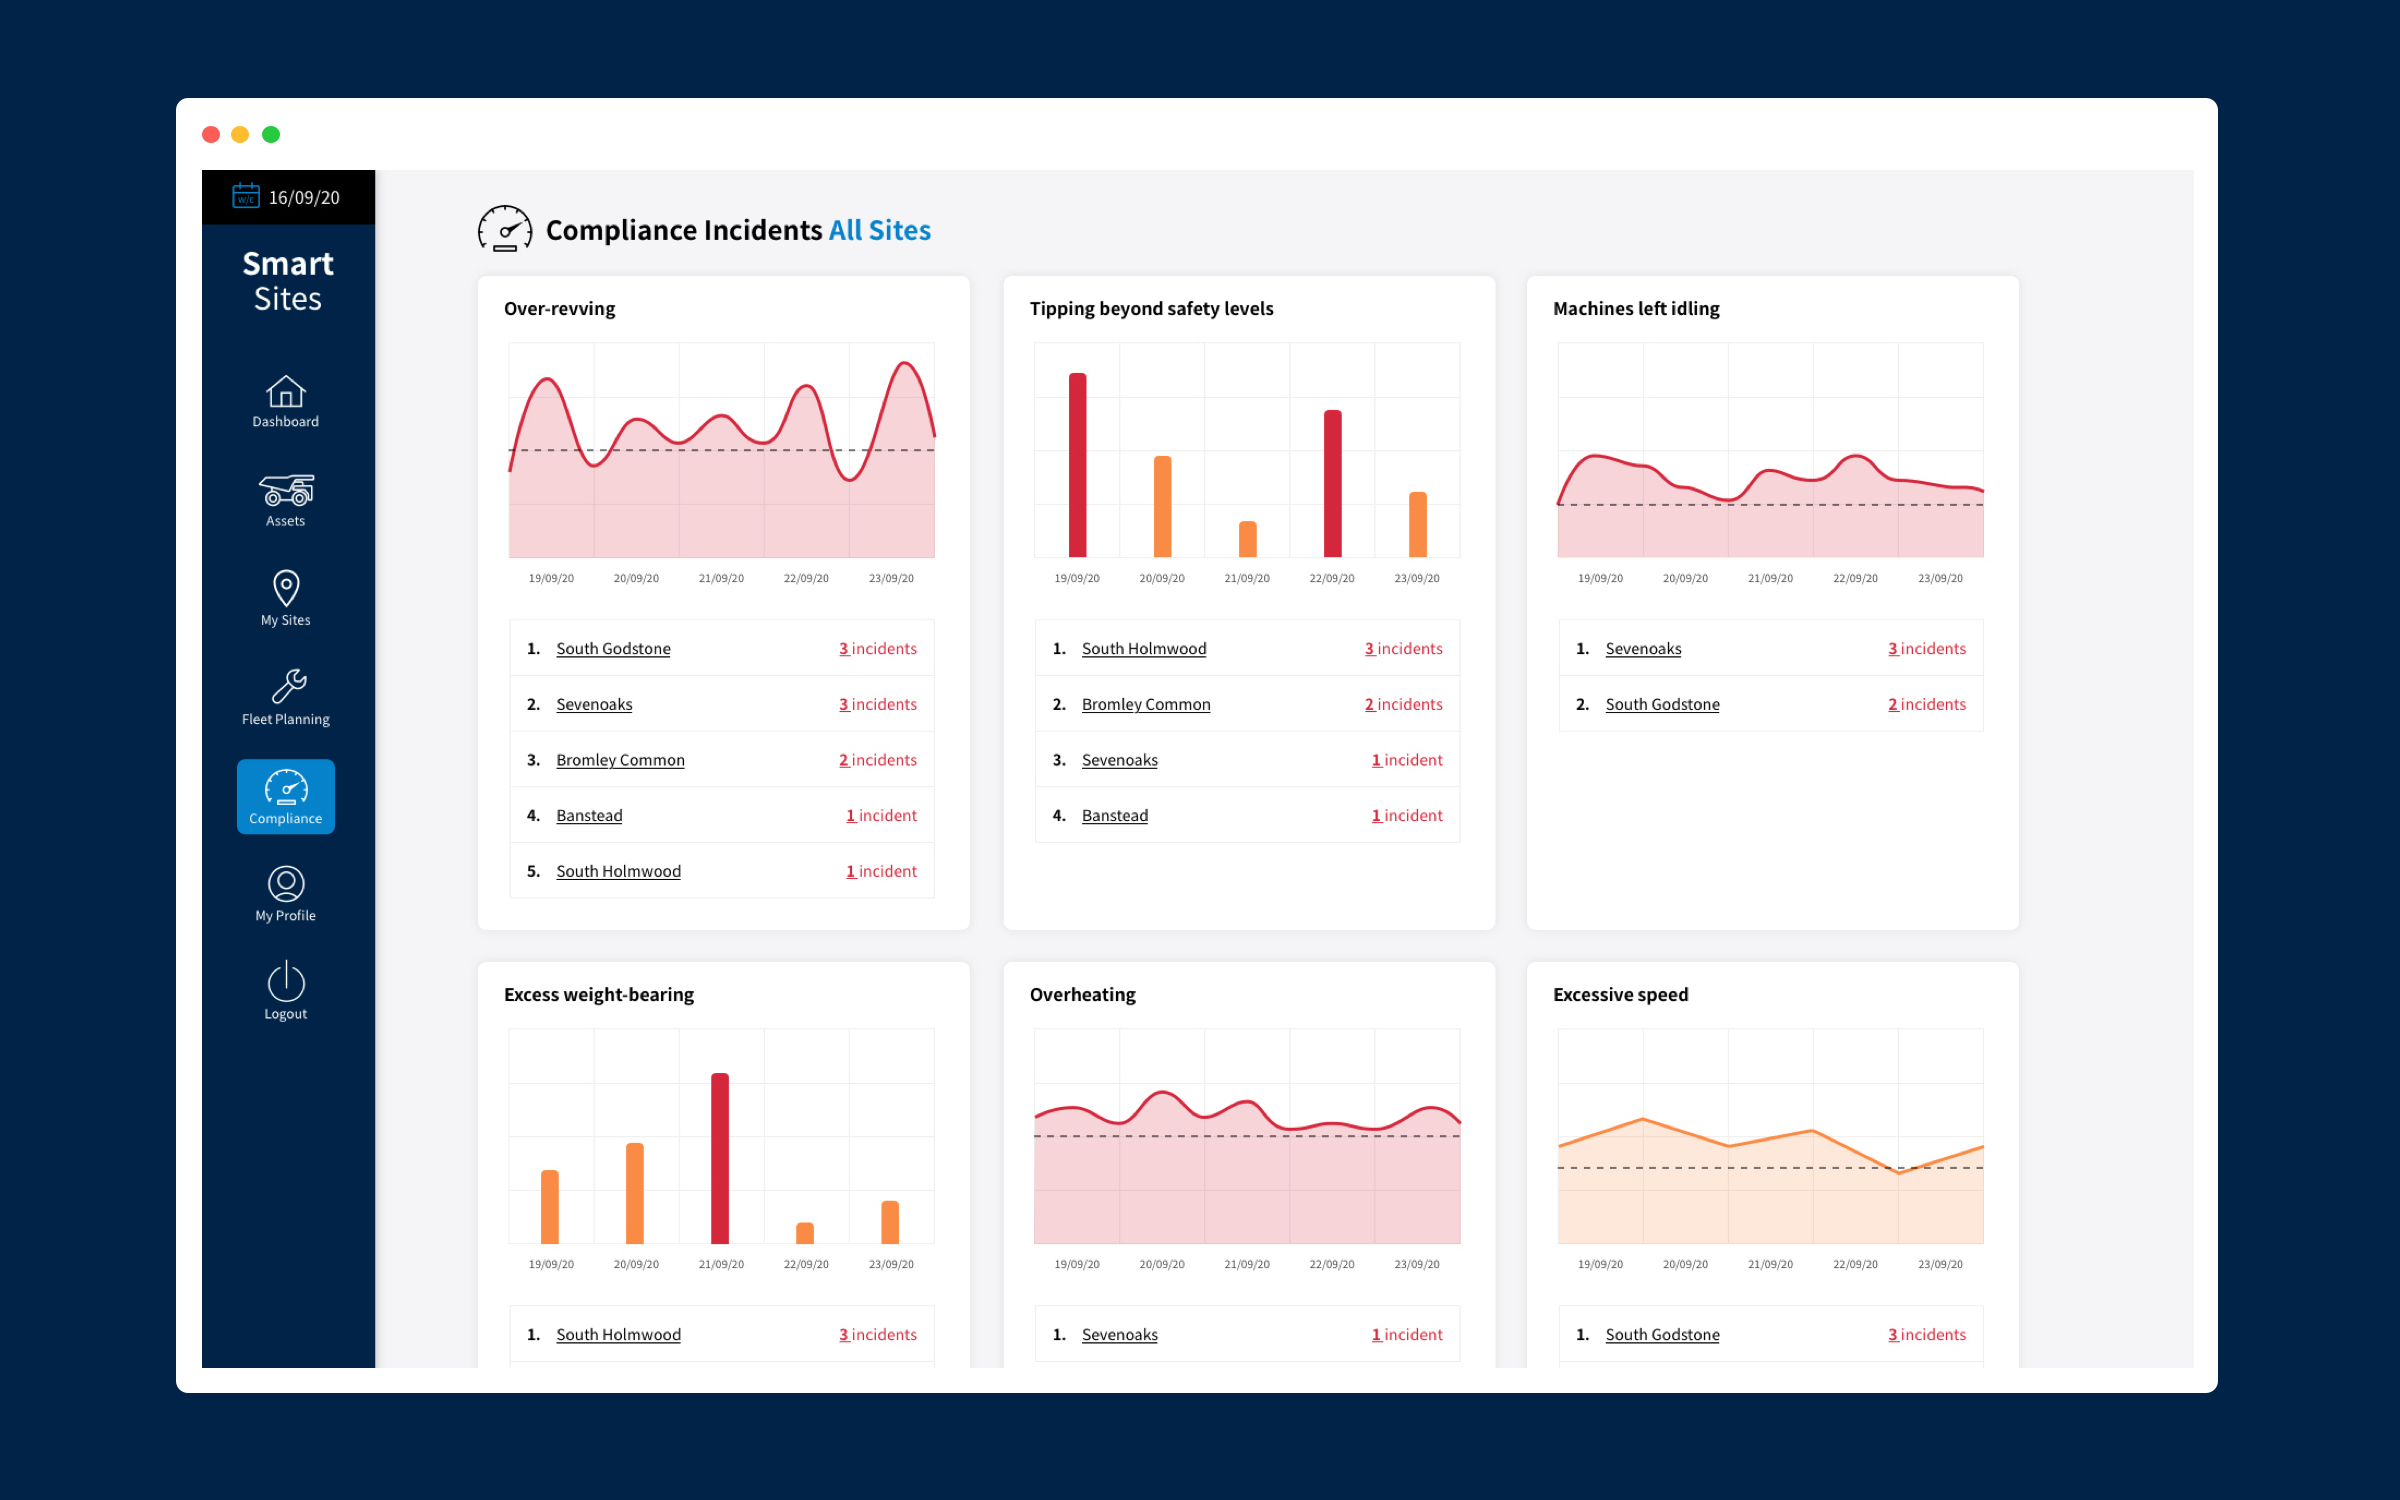
Two options were presented for discussion, a light theme and a dark theme. Dark themes are widey used now, but but still not considered the ‘norm’ I wanted to test reactions from the team but also from the end user.
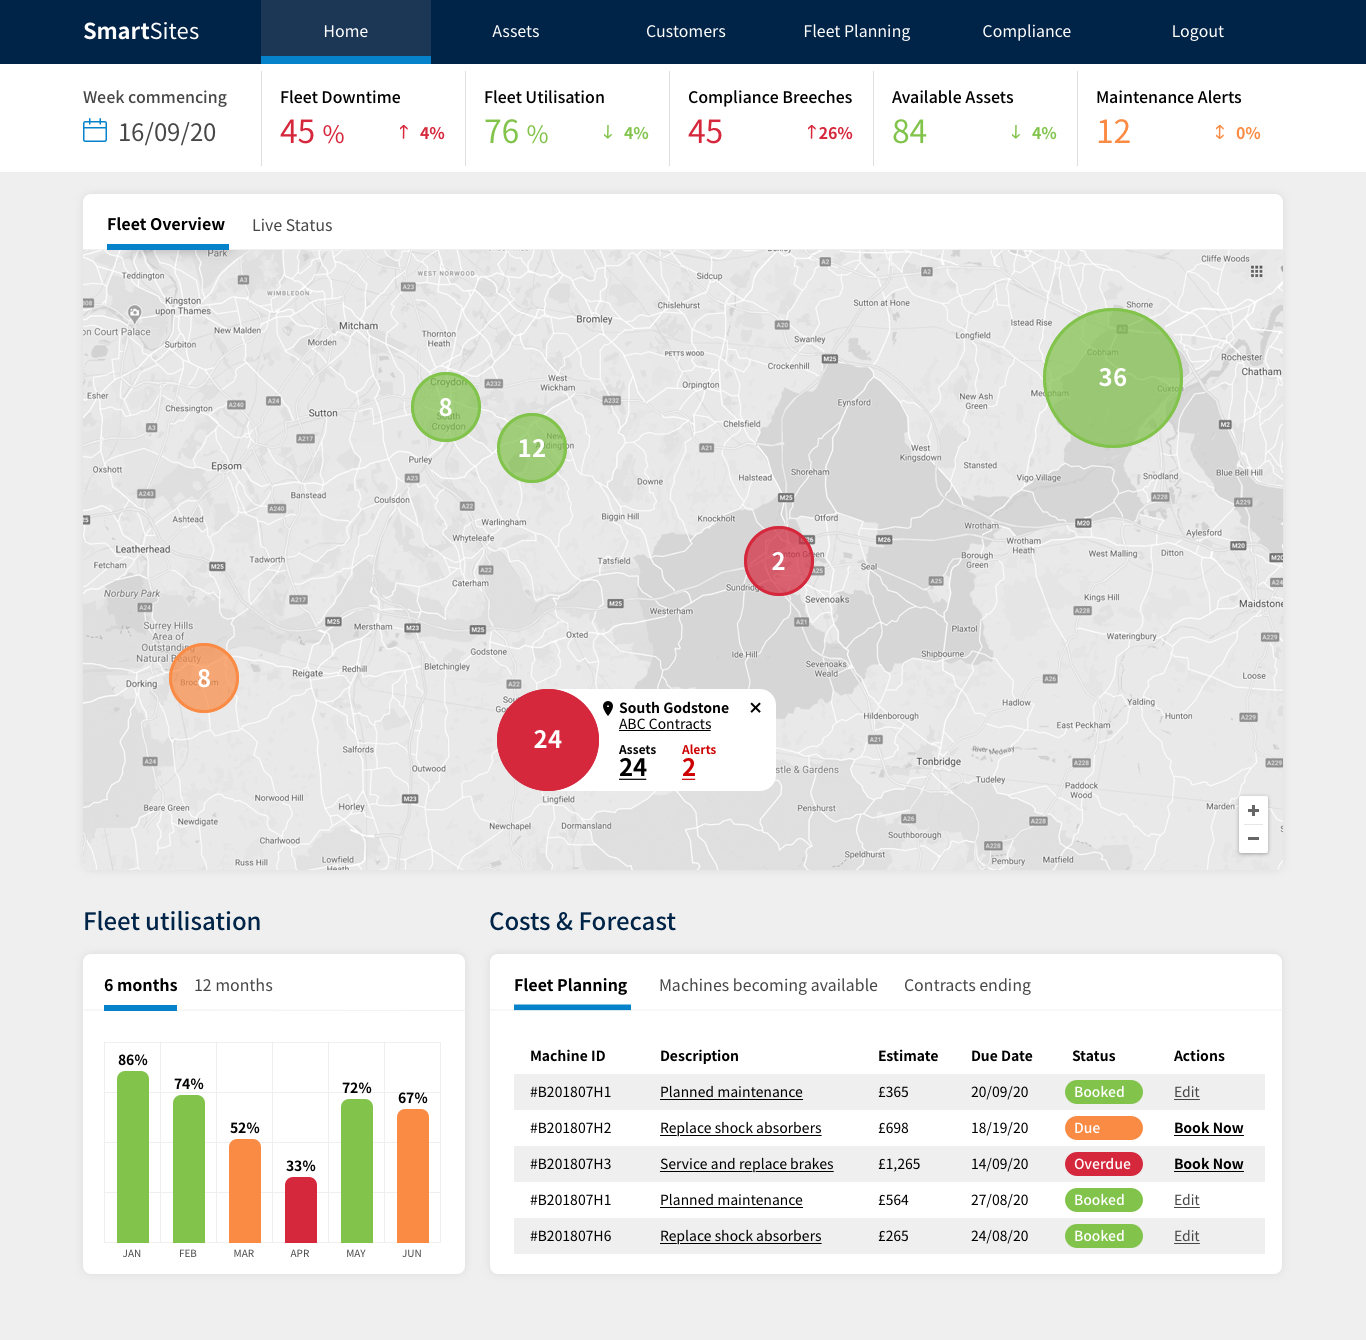
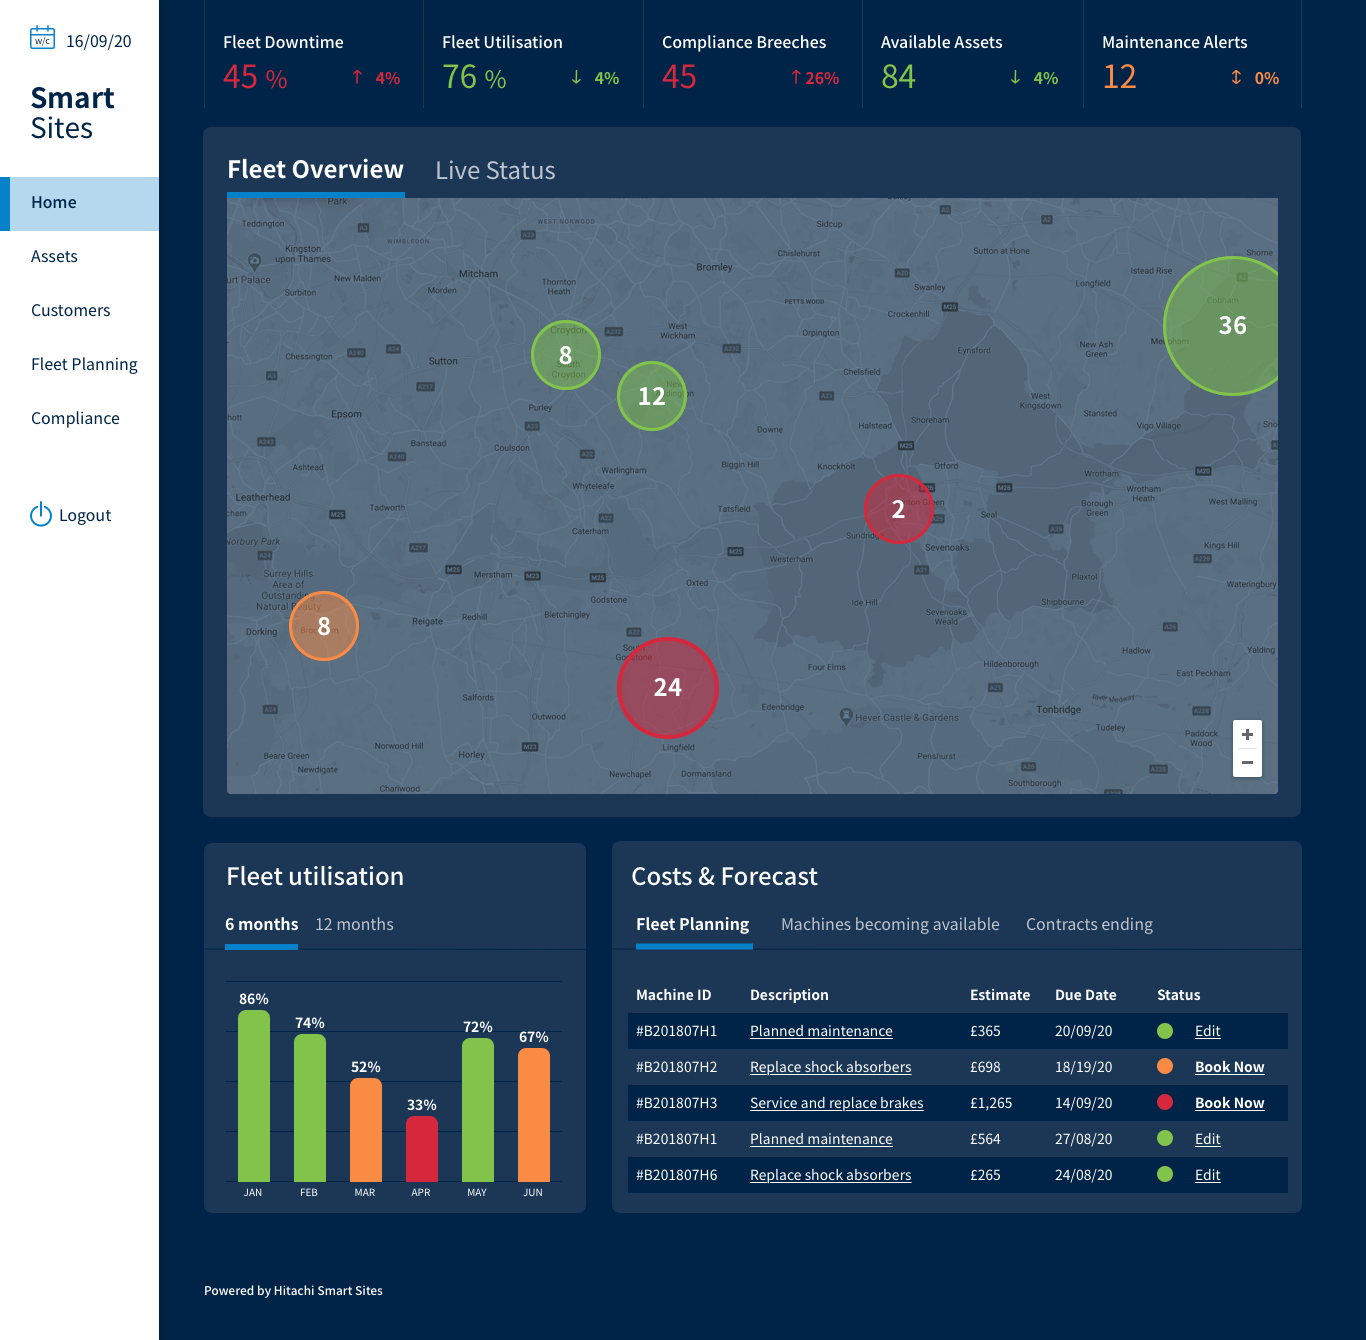
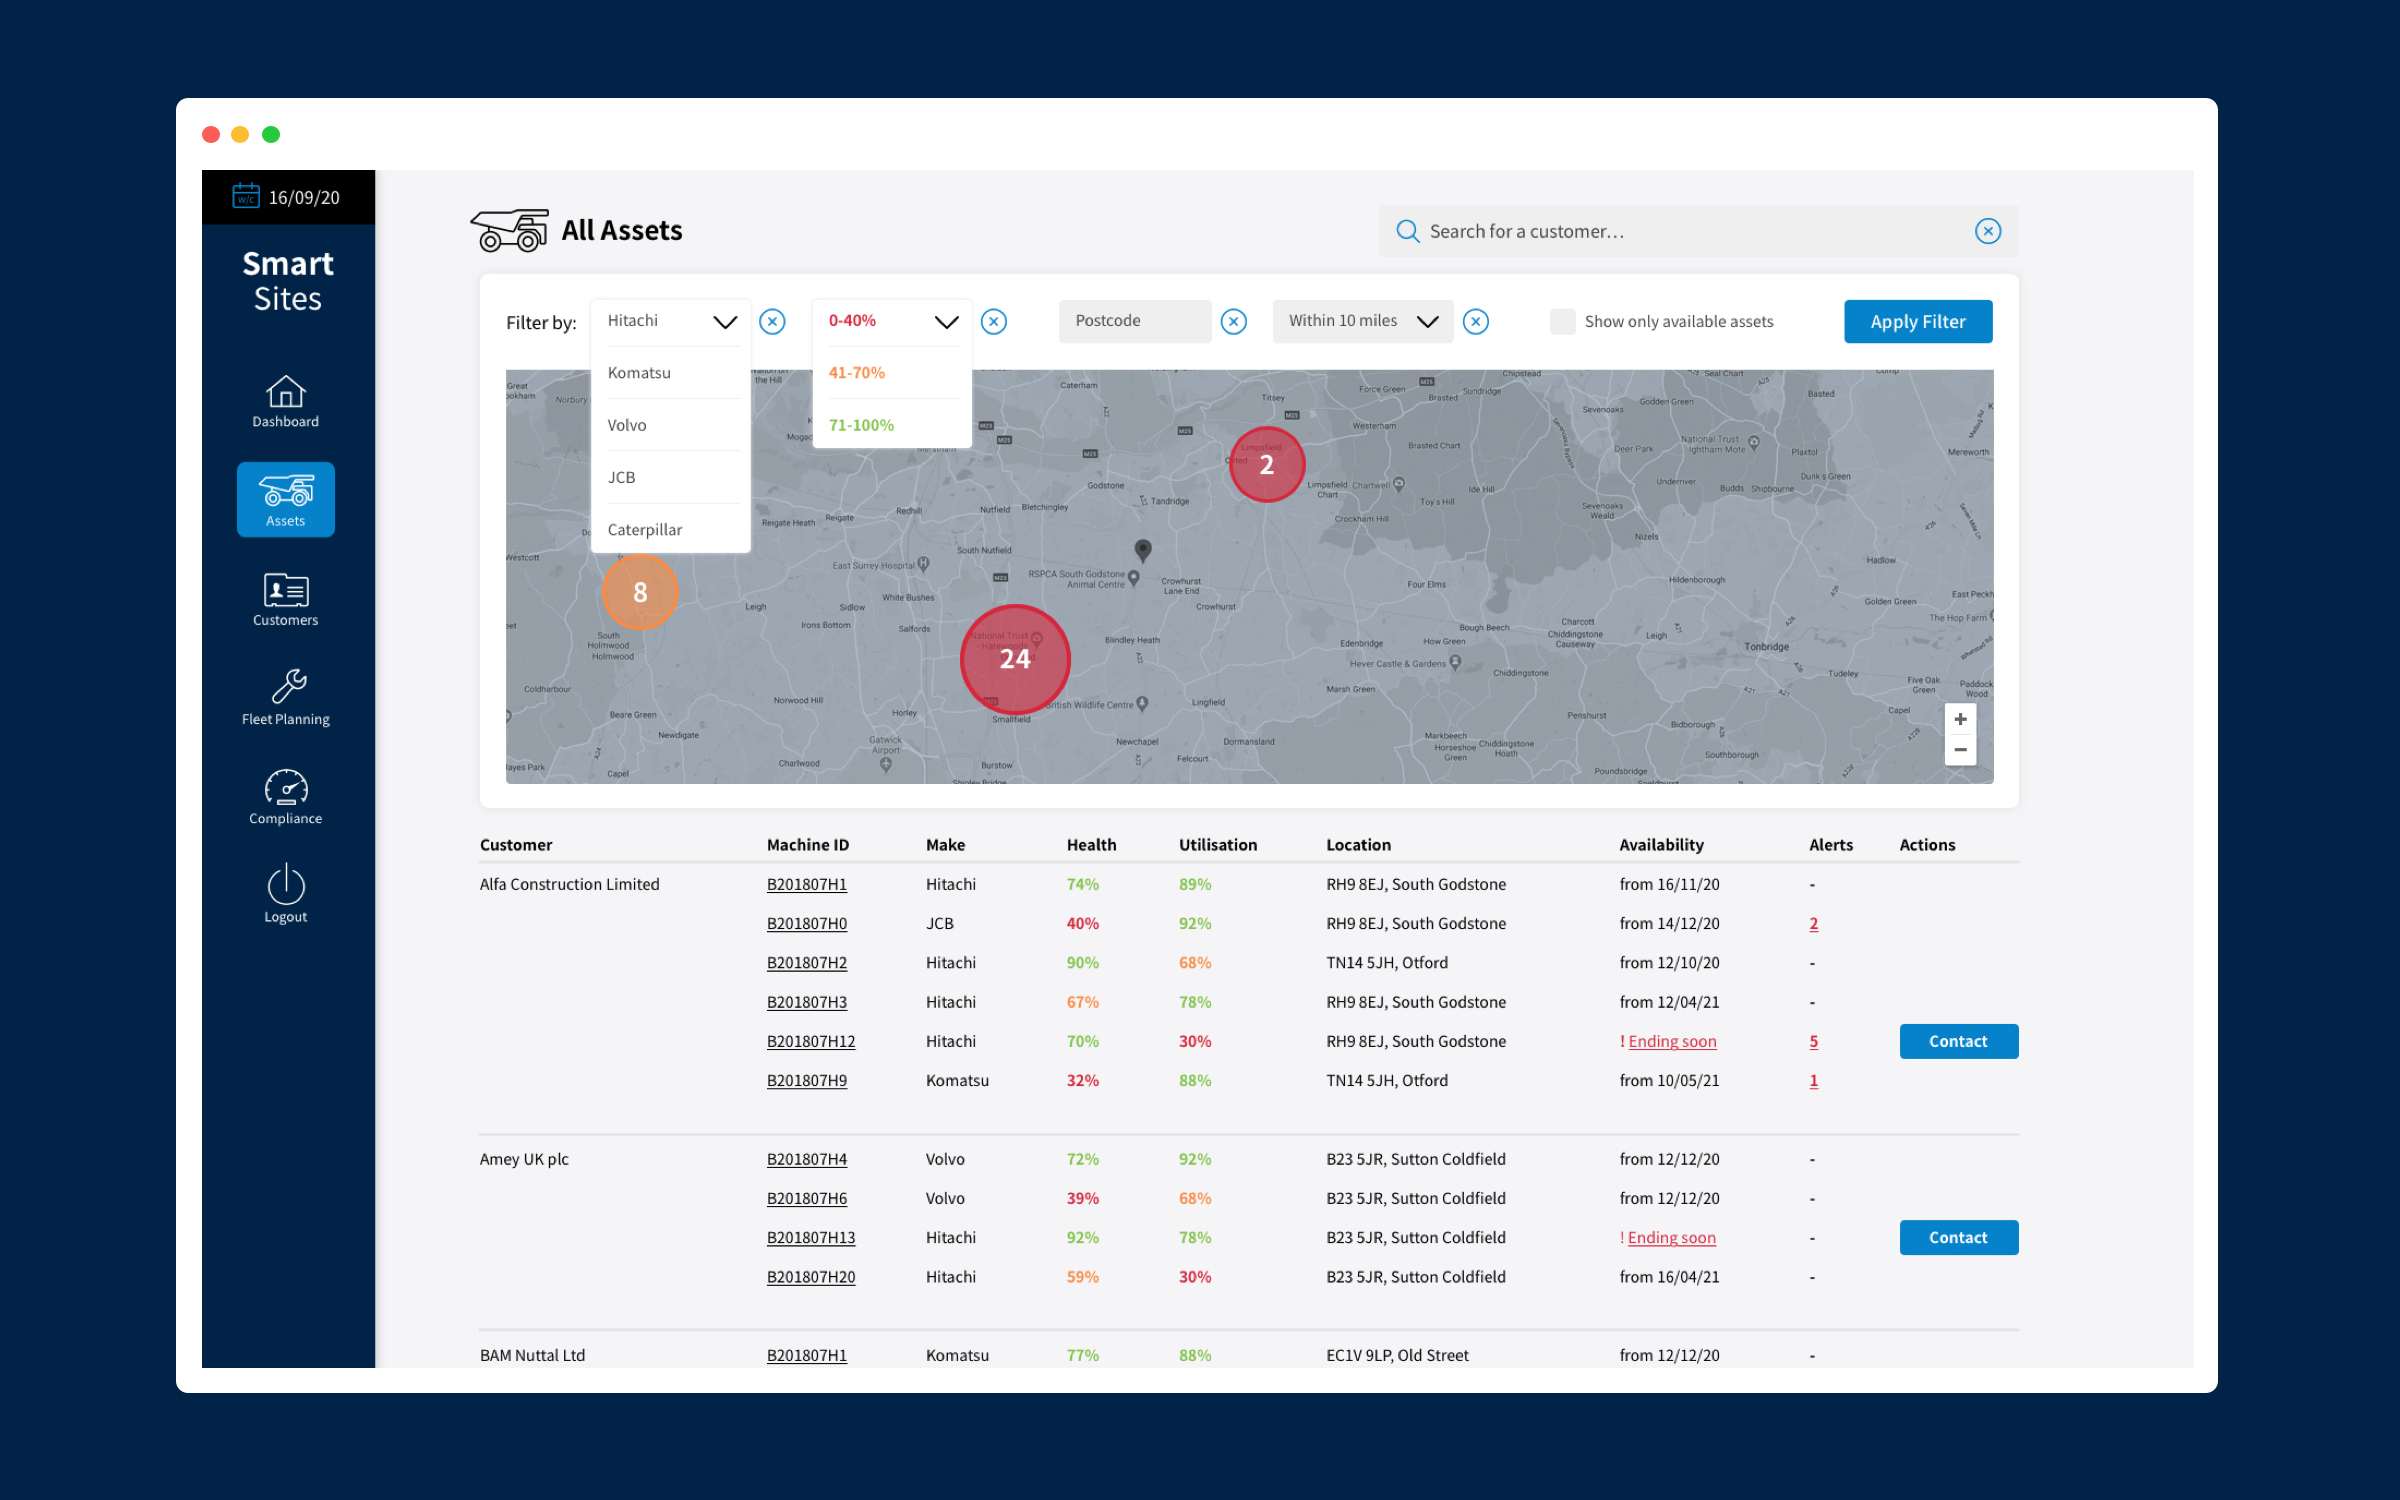
Feedback favoured the light version with added iconography to signpost the journeys and create some more familiarity around the purpose of each section. One challenge, in particular was how to display individual assets on a map view when there could be many vehicles together at one site. The solution was to cluster vehicles into one dot which had a RAG value associated with it.



Validate
Final Prototype
We constantly validated assumptions at every stage in the process. However, to give test subjects and potential customers a full experience of the product, I created a high-fidelity interactive prototype in Sketch, using the Anima plugin. This gave us the ability to add interactive forms, slick animations and clickable elements that all mimic the final product. User-testing with something that appears to be closer to a finished product, results in more detailed and thorough feedback.
The team at Hitachi Social Innovation are also able to showcase the product using this prototype and get early stage feedback from potential customers. Thus validating their original ideas against the real-world desire for the actual product. They are able to better assess and refine the opportunity without having to commit to building something.
We were able to use the prototype to drive a design thinking approach with customers and validate requirements. The prototype also helped in product demo’s and quick POC validations.
Rahul Madhavan Director – Fleet Strategy & New Business Incubation

